
Feb 1st, 2024
What is a System Model?
System models set the methodological rules to calculate the life cycle inventories (LCIs) of products and services activities (Undefined Unit Processes (UPR)) and apply different assumptions to determine the supply (linking) and the distribution of impacts between producers and consumers of products and services (allocation and substitution).
Different system models, namely, “Allocation, cut-off by classification,” “Allocation, cut-off, EN15804”, “Allocation at the point of substitution,” and “Substitution, consequential, long-term,” are offered to meet the demand of different types of studies.
Learn more here.
How Do I Choose the Right System Model for Me?
All system models are based on the same underlying data of real-world processes. Different types of studies benefit from different modeling choices. ecoinvent does not provide recommendations on when to use one system model or another since we consider that only the users know the constraints of their study.
However, for users new to LCI databases, ecoinvent recommends using the cut-off system model 'Database Fundamentals System Models' when starting to work with ecoinvent version 3. This model can be easier to understand for first-time users.
Why is the Amount of the Reference Product Changing?
In the raw version of a dataset, the undefined UPR, the amount of reference product is not always 1. For example, the dataset “cotton production, CN” has a reference flow of 1000kg of cotton fiber. Additionally, an allocatable by-product, cottonseed, results from this activity.
 Whenever the amount of the reference product is not 1 in the undefined UPR, it is scaled to 1 when a system model is applied. With that, also the amounts of all exchanges are scaled accordingly. However, it must be noted that the amounts of the other exchanges are not necessarily divided by 1000 as well. It can be seen from the table that the production of 1000kg of cotton fibre results in carbon dioxide emissions of 335kg, while in the cut-off system model 1 kg of fluting medium is responsible for only 0.269 kg carbon dioxide. The reason is that this dataset has also produced a by-product. Hence, when applying a system model, the exchanges are being allocated between the different reference/by-products according to the methodology of the respective system model.
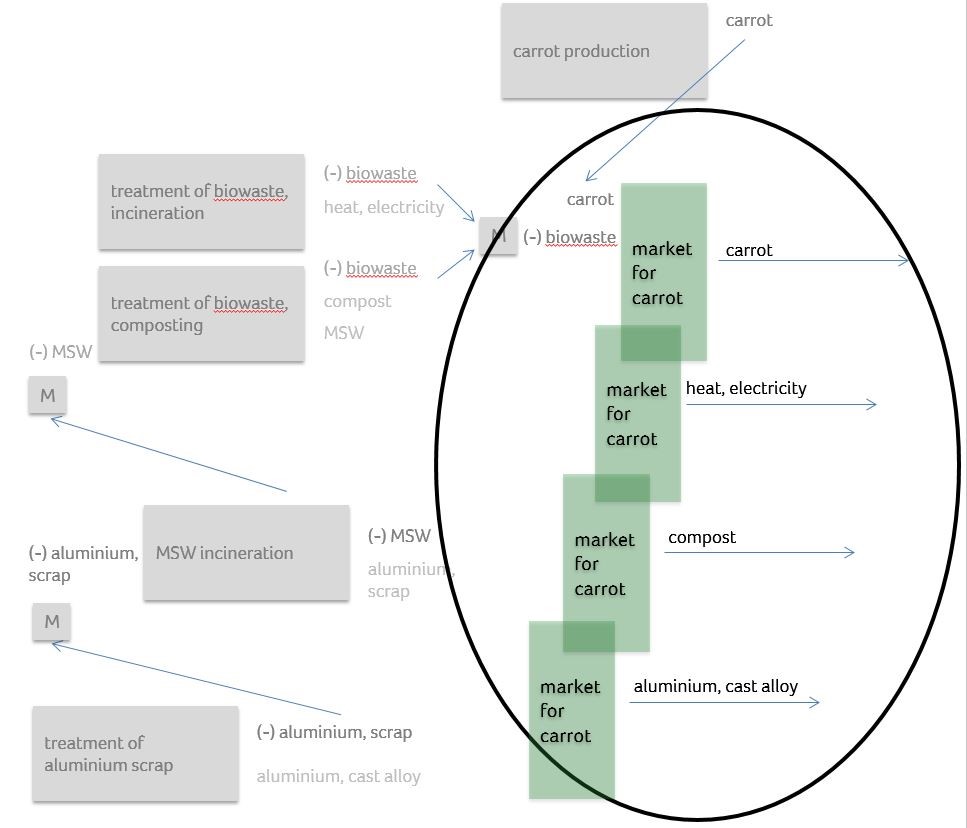
APOS System Model: Why do I Have Carrots on My Recycled Aluminium?
Those are the Involved Activities, their Reference Products, and By-Products
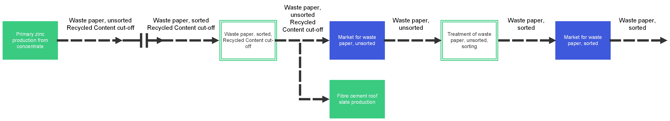
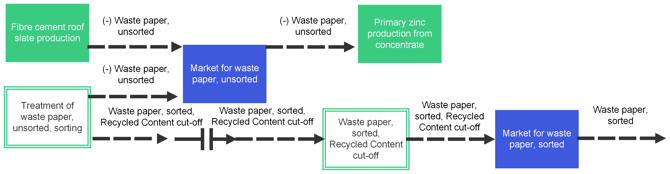
This is how they are linked in APOS
This is the Point of Substitution, where Allocation Applies…

…and those Single Output Allocated DS are created
Merging and Renaming: Final Steps of APOS Liking (for Alu)
- The single output UPR «market for carrot» for «aluminium, cast alloy» is given its original name back: «treatment of aluminium scrap»
- The same process described here has happened in all supply chains where MSW was generated; quite a lot of instances of «treatment of aluminium scrap» will then be generated
- All those activities bearing the same name are then merged together.
Other Considerations
- Similarly as MSW, other MFT are also generating this type of scrap, and will follow the same linking procedure described, merging in the end into one single «treatment for aluminium scrap» linked UPR.
- This UPR bears a share of the burdens of all producers of MFT that, when treated, generate alu scrap as by-product.