
Feb 1st, 2024
What is a Market?
Learn more about markets, market groups and transport, and product losses in markets here.
How are Electricity Market Mixes Modeled?
Electricity market datasets are regularly updated and expanded to represent the latest available statistical data on present and projected future electricity mixes. The applied methodology as well as differences compared to previous versions are explained here.
Cut-off & APOS System Model
In the attributional system models, electricity mixes from v3.4 upwards are based on statistical data and are available for all 142 countries which are part of the IEA statistics (primary data source: IEA, 2016). Usually, the statistics three years prior to the release year of the database version are used (e.g. 2017 for v.3.7.1 released in 2020). This is due to the final comprehensive statistics being published with this delay. That means, 100% of (statistically represented) global electricity generation is covered through country-specific market compositions.
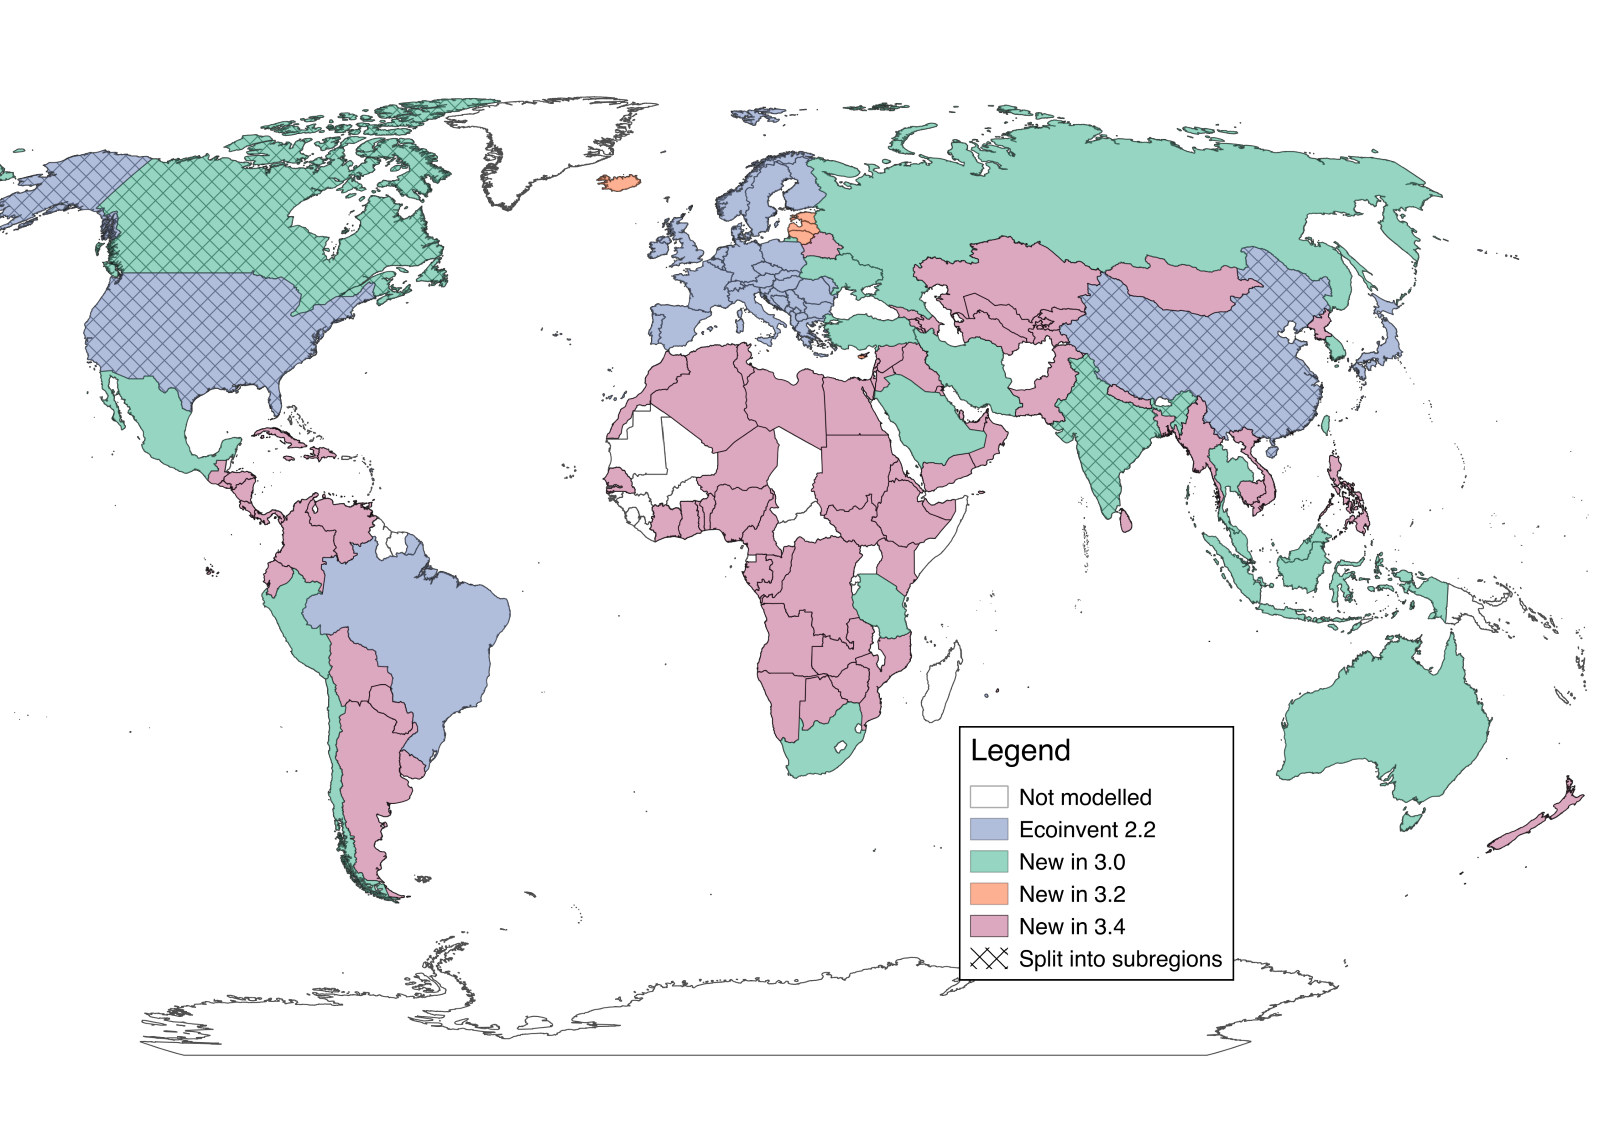
Figure 1: Map of geographical coverage of electricity markets in ecoinvent version. The colors differentiate markets by the database versioning which they were added.
Consequential System Model
The consequential system model contains future electricity market compositions specific to 40 countries which together represent 76.5% of the global energy output. These mixes are based on projections from (inter-)national authorities such as the European Commission (2016) and the international Energy Agency (2016). The new markets are a significant improvement of the consequential system model and provide a consistent basis for electricity supply in consequential LCA.
For countries where no specific scenario was available (marked orange in the map), the marginal electricity mix for the Rest of the World (RoW) applies. The RoW mix is calculated using the projections for the entire world from the “current policies” scenarios of the IEA (2016) minus the sum of all country specific projections. Given the variety of the projection sources, there are some technologies which’s global electricity production according to the IEA is smaller than the sum of all the country specific scenarios for the same technologies. In these cases, the electricity production from these technologies is considered to be zero and is not part of the RoW marginal mix.
Imports are not taken into account in the composition of the consequential market mix because of the insufficient availability of consistent data. As this was already the case in previous versions, this does not subtract from the quality of the new data but it remains a limitation of the projection data.
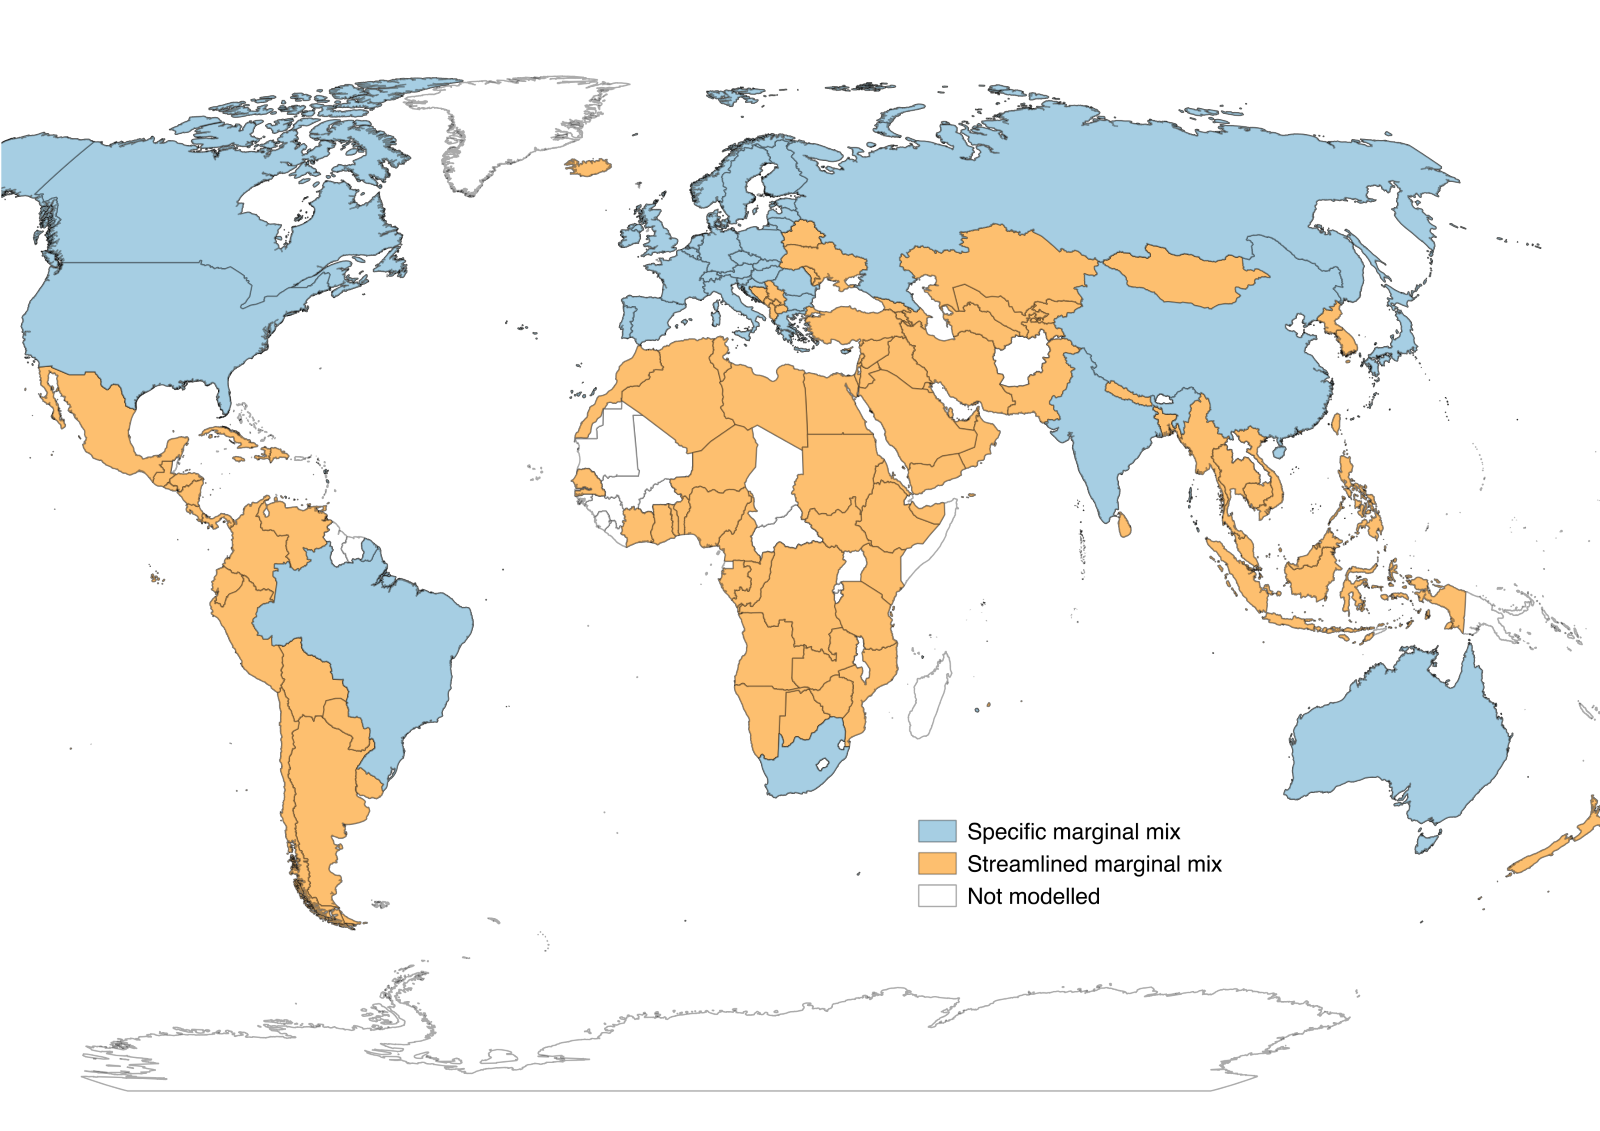
Figure 2: Map of geographical coverage of consequential electricity markets in ecoinvent version 3.4. The colors differentiate markets with a specific (blue) or streamlined (orange) marginal electricity mix. Note that Chile has a specific marginal mix, despite it being colored orange.
How Does the Approach Introduced with v3.4 Differ From Previous Versions?
In versions 3.01 to 3.3 electricity mixes were generated by the linking algorithm, as described in the Data Quality Guidelines of ecoinvent version 3, section 4.3. The contribution of producing activities to the markets was calculated based on the production volumes specified in the electricity producing activities. From version 3.4 onwards, this rule does not apply. Instead, market mixes are generated by directly editing the contribution of the producing activities to the markets in the market activity itself.
The new approach may yield market shares that are not consistent with the production volumes specified in activities. Similarly, the Technology Level is not anymore deciding on which activities contribute to which market in the consequential system model.
How can I see the Technology Mix of an Electricity Market?
The composition of electricity mixes, i.e. the contribution of electricity production, storage and imports to electricity markets, can be seen in the linked electricity market datasets of any system model (see Figure). You can also find the market composition of any linked market in the file “market composition_X.X.xlsx” in the “Files” section of ecoQuery.
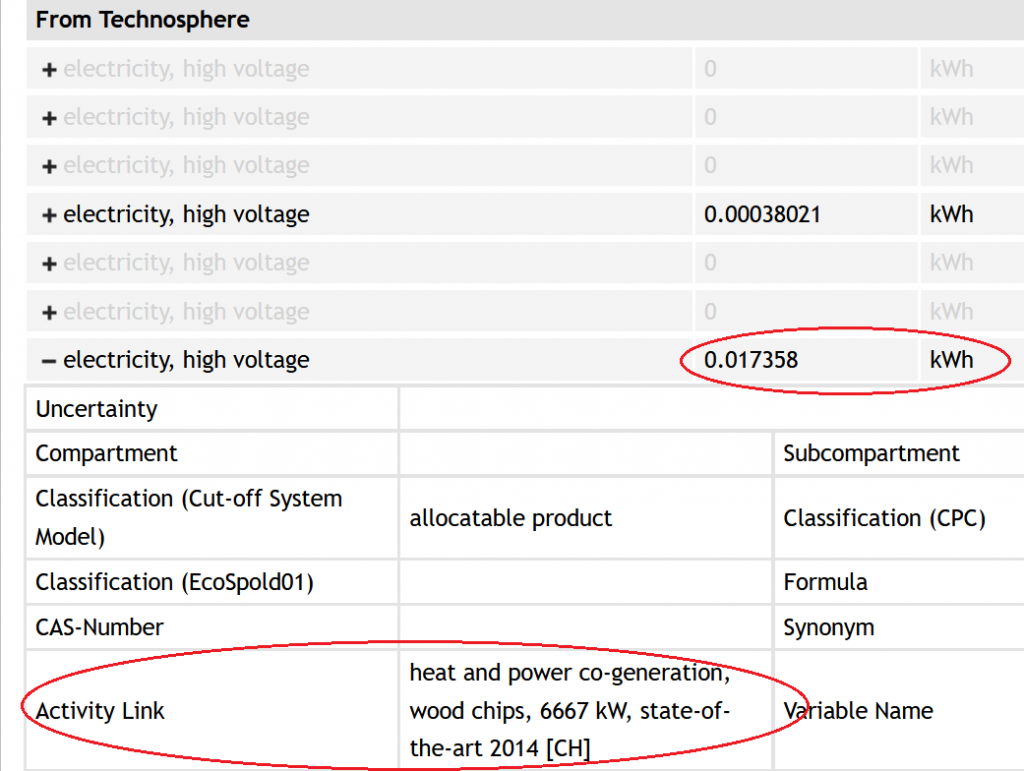
Figure 1: Screen shot from ecoQuery, dataset “market for electricity, high voltage, CH”, version 3.7.1, cut-off system model, August, 2021.
However, due to imports from other countries the linked datasets do not allow to see the electricity mix by technology, for example 45% hydro power, 25% nuclear. For this type of breakdown please consult the electricity analysis files ” electricity_analysis_X.X_Allocation, cut-off.xlsx ” (from 3.6 upwards) or “electricity_market_technologies_vX.X.xlsx” (for v3.4 and v3.5) available in the “Files” section of ecoQuery.
Tracing back the convoluted chains of imports these files show a detailed list of all activities which are directly or indirectly supplying an electricity market. Aggregating this list by technology, i.e. disregarding the geographical origin of supplying activities, results in the technology mix for each electricity market in v3.3, v3.4 and v3.5 (see tab “by_technology”).
From v3.6 upwards a new file for detailed information on the electricity markets is available. Please see the “read me” tab in the file itself for an explanation of the content.
For example, the current average (attributional, cut-off system model) and the long-term marginal electricity mix 2015-2030 (consequential system model) mix of the high voltage electricity market in Switzerland (v3.4) are visualized in the below graphs.
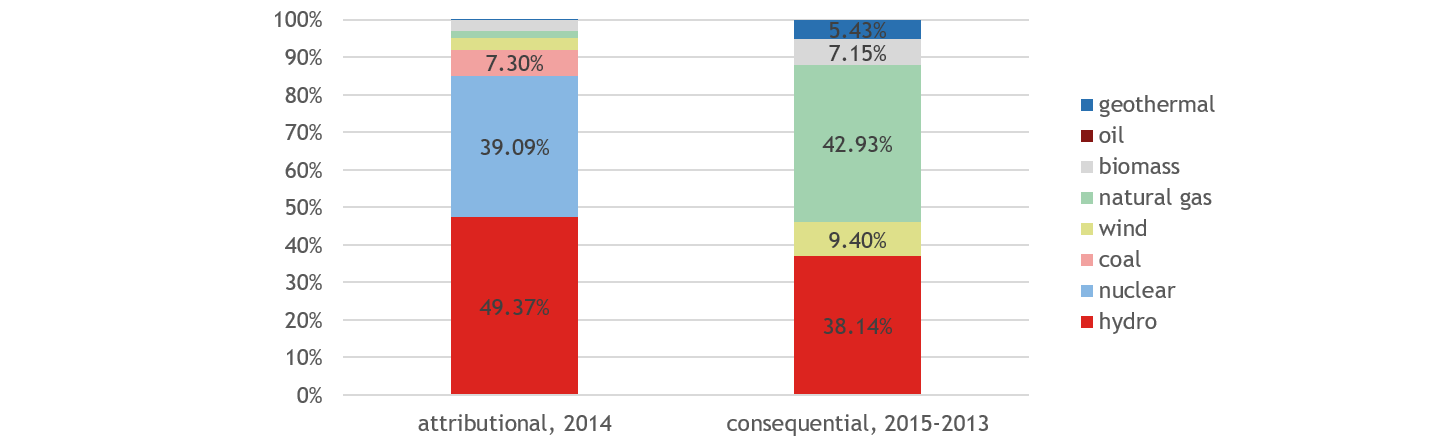
Figure 2: Attributional and consequential electricity mix in Switzerland by generation technology as of ecoinvent version 3.4., October 2017.
Each market also accounts for losses. Note that in addition to the losses from transmission (which are commonly below 10%) this also includes losses occurring in pumped storage plants. Electricity supplied by pumped storage power plants is generated from electricity itself rather than from a primary energy carrier. It is therefore disregarded in the technology mixes. As a result, markets with a large pumped storage capacity show very high losses. For example, in Uruguay losses amount to 38%.
References
European Commission. (2016). EU Reference Scenario 2016. https://doi.org/10.2833/9127 Eurostat (2017) Energy Balances (2017 edition), http://ec.europa.eu/eurostat/web/energy/data/energy-balances
International Energy Agency, (2016), World Energy Outlook 2016. Paris. https://doi.org/10.1787/weo-2016-en
Map of geographical coverage of electricity markets in ecoinvent version